Posted on Wed, 06/11/2014 - 11:11
The modeling engine behind the CESAR diagrams is called CanESS, short for the ‘Canadian Energy Systems Simulator’. This short name hides a very large and complex modeling engine. You will be glad to know that in this blog, we are only going to focus on a small part of it: the numbers behind the calculation of energy use for personal transport.
![]()
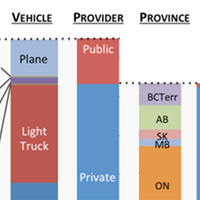
Figure 1. Deconstructing Energy Demand for Personal Transport.
The CanESS model estimates that Personal Transport in Canada used about 1298 petajoules (PJ) in 2010. This is equivalent to about 14-15% of the total demand for energy services of Canada. Total transportation demand, including both personal and freight transport is approximately twice this number
The CanESS model generates the 1298 PJ value through a chain of calculations that allow energy demand to be specified by vehicle type, province, fuel type, highway versus city driving or engine type as shown in Figure 1. Knowing exactly where and how much energy is used in the personal transportation sector is valuable for informing policy makers where to focus attention if they want to transform this part of Canada’s energy systems.
However, the real power and value of CanESS is that the model consists of a series of detailed stock and flow calculations that rely on a wide range of government data resources, including:
- Population, family and other demographic changes [from Canadian Socioeconomic Information Management System (CanSIM), Statistics Canada (StatsCan)];
- Passenger km traveled per year [from Demand and Policy Analysis Division (DPAD), and the Office of Energy Efficiency (OEE), Natural Resources Canada (NRCan)];
- Vehicle stocks by type and year [from CanSIM, StatsCan and DPAD, NRCan];
- Transport Energy use [from CanSIM, StatsCan and DPAD, NRCan];
- Vehicles fuel efficiency by fuel type and model year [from Transport Canada and the US Environmental Protection Association (EPA)];
- Greenhouse gas emissions associated with specific fuel use [DPAD, NRCan].
These government data resources are combined with insights gleaned from the scientific literature and from a range of other sources to link it all together so that credible calculations can be made of energy use and GHG emissions through a range of ‘lenses’ on the energy systems of Canada and its provinces.
![]()
Figure 2. Integration of some of the variables that drive energy use and GHG emissions in the ‘Personal Transportation’ module of CanESS.
Figure 2 shows how a number of these parameters are connected within the CanESS model. The application of an average trip length (specific to each province, trip type, mode, and time) to the trips demanded results in a passenger kilometer demand for each province, trip type, mode and year. Matching this demand with a load factor, share of road use type, and the vehicle stock results in the annual distance travelled by personal vehicles, within each province, road use type, vehicle class, power source, fuel type, vehicle age and year.
Finally the model calculates the energy use and greenhouse gas emissions (GHG) for these vehicle kilometers based on model year and age-dependant fuel consumption. The result is a true bottom-up, highly detailed measure of energy use and GHG emissions associated with personal private transportation. Rolling up this incredible amount of detail and combining it with the public transportation energy use will get you back to the 1298 PJ that you can see in Figure 1.
For policy makers or technology developers, there is often an interest in shifting technology market share or behaviour to achieve societal, economic or environmental goals. Each of the yellow labeled variables in Figure 2 provides a ‘lever’ that is responsive to policy or technology change. The large interconnected historical database in CanESS can be used to identify trends that provide a valuable baseline for assessing the feasibility of introducing new technology or policy instruments. The CanESS model can then project forward to calculate the implications of such a technology or policy change on flows of energy or GHG emissions within each province under a variety of scenarios.
For researchers, the CanESS model offers a canvas on which to create an enhanced understanding of the forces affecting energy demand and GHG emissions in Canada. With this understanding, it is possible to explore the costs, benefits and trade-offs associated with a range of technological changes or policy instruments designed to transform our energy systems toward energy, environmental and economic sustainability.
Comments
Brendan replied on Permalink
Accounting for walk/bike
Do you have any comments on accounting for human-powered modal shares like walk/bike. Conceptually these transportation forms do use "energy", and conceptually you could account for them in calculations of GHG and energy intensity per km travelled or even per joule. However they don't seem to fit into the Sankey diagrams that start with industrial forms of energy production, other than shrinking end use demand.
So what happens in the model when there is a modal shift towards walk/bike other than reducing overall energy use and emissions. Is there anyway to account for the "efficiency" of these forms of transportation?
A second question
What is involved in the per GDP denominator when divided by sector. How do you define the transport sector?
Thanks