sankey diagrams

Posted on Monday, June 26, 2017 - 06:46 by David B. Layzell, PhD, FRSC , Benjamin Israel, MS, Bastiaan Straatman, PhD, Ralph Torrie

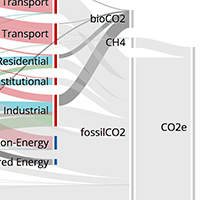
Energy systems – the production and use of fuels and electricity – are under intense pressure to change for the good of the environment and the economy. However, the flow of energy through these systems is not the problem. Rather it is the flow of carbon, especially when those flows bring carbon dioxide (CO2) and methane (CH4) to the atmosphere where they become greenhouse gases (GHGs).

Six months ago, CESAR released Sankey diagrams for Canada showing how energy flows from the sources we extract from nature, to the demands of society for fuels and electricity. Today, we are pleased to release a new set of Sankey visualizations – the first of their kind – showing how carbon flows through the same fuel and electricity systems.


Posted on Tuesday, December 13, 2016 - 06:05 by David B. Layzell, PhD, FRSC , Benjamin Israel, MS, Bastiaan Straatman, PhD, Ralph Torrie

CESAR is pleased to offer open access to our latest, interactive, multi-year Sankey diagrams showing the energy systems of Canada and its provinces between 1990 and 2013. The web portal to these Sankey diagrams allows users to move rapidly between hundreds of visualizations showing flows from energy sources to energy services for individual jurisdictions and years.


Posted on Tuesday, January 6, 2015 - 09:00 by David B. Layzell, PhD, FRSC , Benjamin Israel, MS

On Dec 11, 2014, researchers from HEC Montreal, the Business School at University Montreal, released an assessment of the State of Energy in Quebec. The French-only report - État de l’énergie in Quebec – 2015 - received much attention in the province, but less so in other parts of Canada, even though the insights are important and relevant to all Canadians. As contributors of both data and graphics to this study, CESAR researchers have a special interest in the work, and thought that a blog on the report would be a good way to kick off 2015.


Posted on Thursday, May 1, 2014 - 09:10 by Ralph Torrie

Visualizing Canada’s energy systems helps us to understand the challenges we face and then identify alternative pathways to a more sustainable energy future. Within CESAR, we have created some exciting new visualization tools, powered by the Canadian Energy Systems Simulator (CanESS), with its unique capacity for looking both forward and backward in time.


Log in or register to post comments.