Posted on Tue, 04/26/2016 - 06:45
By Ralph Torrie and David B. Layzell

Figure 1. Image of the recently published paper “Torrie RD et al. 2016. Understanding energy systems change in Canada: 1. Decomposition of total energy intensity. Energy Economics 56: 101-106.”
Understanding the factors leading to this improvement in Energy Intensity (i.e. the primary energy use (E) per $US of gross domestic product (GDP)) should provide valuable insights for policy makers regarding those aspects of the Canadian economy that contribute to, or work against, efforts to reduce Canada’s GHG emissions and transform energy systems toward sustainability. This is the focus of a paper we have recently published in Energy Economics (Figure 1).
Changes in Canada’s Energy Intensity: 1995-2010
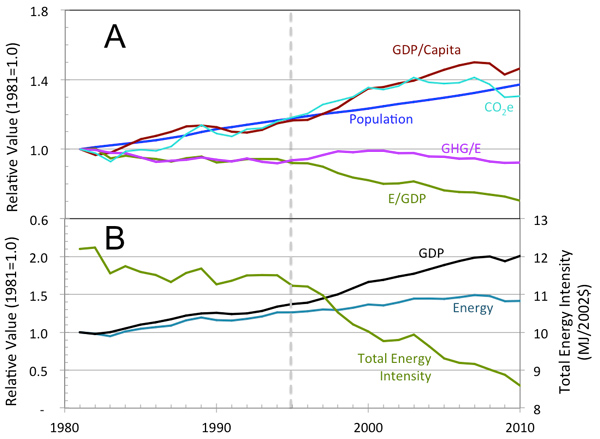
Figure 2. Changes in Kaya factors for energy-based emissions in Canada, 1981-2010 where CO2e [Mg] = Population [capita] x GDP/Population [$/capita] x Energy use/GDP [GJ/$] x GHG/Energy use [MgCO2e/GJ]. B shows the decoupling of GDP and energy growth after 1995, with the subsequent improvement in total energy intensity.
Between 1995 and 2010, the total energy intensity (E/GDP) of the Canadian economy declined by 23% or 2.64 megajoules per dollar (MJ/$, in 2000 dollars), from 11.24 MJ/$ to 8.60 MJ/S (Figure 2).
In 2010, energy-related GHG emissions in Canada totalled 577 million tonnes of CO2 equivalent (Mt CO2e). But if the economy had still been operating with the energy intensity it had in 1995, emissions in 2010 would have been 767 Mt. And the trend continues: by 2013 the E/GDP ratio in Canada was down another 6% compared to 2010, effectively destroying another 30 million tonnes CO2e of GHG emissions1.
There can be little doubt that low-carbon futures will be those in which E/GDP continues to decline and improve.
What determines a nation’s E/GDP?
The amount of fuel and electricity that an economy uses to generate its output of goods and services, as measured by the E/GDP ratio, is a highly aggregate indicator and requires careful interpretation. After all, E/GDP could be impacted by climate, per capita income, improvements in technological efficiency, the mix of goods and services being produced, transformative innovations, and other factors.
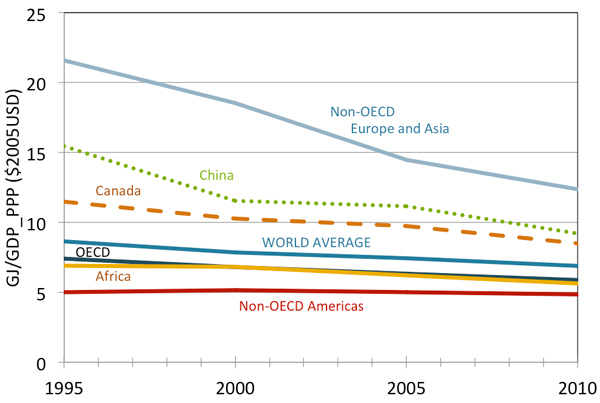
Figure 3. Energy Intensities (E/GDP) values for China and Canada, compared to those of regional economies over the 1995-2010 period (from IEA data).
Countries that use fuel and electricity more efficiently will have lower E/GDP ratios, all else being equal, but all else is never equal. For example, the E/GDP ratio for African economies is not too different from the OECD average (Figure 3), and yet the economies and energy systems could hardly be more different. Some activities, such as primary resource processing, are inherently energy intensive, requiring many times more energy per dollar of value added than general manufacturing or the provision of financial and other services.
Consequently, countries like Canada that have relatively large primary processing sectors will have correspondingly higher E/GDP ratios. The E/GDP of the Canadian economy in 2010, despite the decline after 1995, was still 1.9 times higher than in Europe. There have been steep declines from the relatively high E/GDP ratios of China (Figure 3) and the economies of the former Soviet bloc, while the rich, post-industrial economies of the OECD have relatively low E/GDP ratios. This is partly because of the prevalence of the service sector in these economies, but also because of consumer saturation of basic energy services like residential home heating and personal mobility.
Highlights of our research
To better understand the relationship between the makeup and dynamics of GDP and the corresponding level and pattern of fuel and electricity consumption, we investigated the dynamics of Canada’s E/GDP ratio between 1995 and 2010. To do so, we used index decompositional analysis with a standard logarithmic method, applied to the database resource embedded in the Canadian Energy System Simulator (CanESS V6) model from Ottawa-based whatIf? Technologies Inc. (Our methodology is detailed in the Energy Economics paper). Among the questions we asked were:
- How much of the decline was due to energy efficiency, and how much was due to structural and other changes in the economy that resulted in lower energy service demands per dollar of economic output?
- How much upward pressure on E/GDP resulted from trends like the shift to more energy-intensive bitumen production and away from conventional oil in the oil sector, and how much downward pressure resulted from energy intensity declines in other sectors?
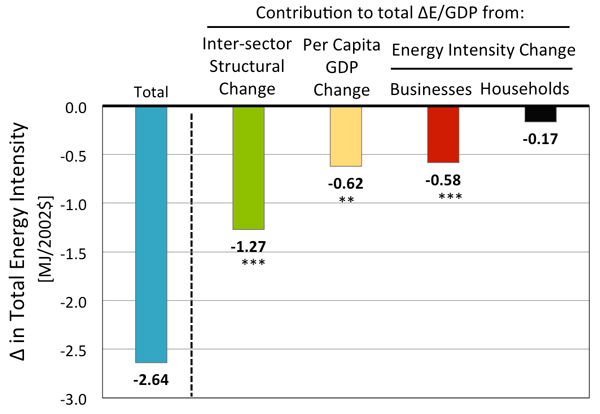
Figure 4. The contribution of various components of the Canadian energy system to the observed change in total energy/GDP over the period 1995–2010. Energy intensity for businesses is in terms of MJ/$, while energy intensity for households is in terms of MJ/ person.
An initial decomposition analysis to address these questions resulted in the following insights on the reasons for the decline in E/GDP of the Canadian economy between 1995 and 2010:
Inter-sector structural changes were the major contributor. We confirmed that changes in the makeup of GDP often leads to changes in the energy intensity of an economy. Between 1995 and 2010, nearly half (48% or 1.27 MJ/$GDP (in year 2000 dollars)) of the total 23% decline in E/GDP in Canada was the result of inter-sector structural change in the economy (Figure 4).

Figure 5. Energy intensity (A) and GDP (B) associated with the business economy sectors in Canada in 1995 (red bars) and 2010 (black bars).
In other words, there was an increased contribution to the total GDP of the low energy-using commercial & institutional services sector compared with the high energy-using manufacturing and heavy industry sectors. This included a relative shift of economic production from energy-intensive primary industries to less energy-intensive manufacturing and services.
We looked at the value added and the energy consumed of the six aggregate sectors that generate Canada’s GDP: oil and gas production, power generation, energy-intensive industry (e.g. cement, steel), general manufacturing, freight transportation, and commercial & institutional services (Figure 5).
The fuel and electricity consumed per dollar of output is 30 times higher for the oil and gas and energy-intensive industries than for the provision of services. Consequently, even a relatively small shift of economic output toward services has a significant impact on the energy intensity of the nation’s economy.
Demand for energy services is near saturation in Canada. We divided Canada’s total use of fuel and electricity into two categories – the energy used by the business economy to produce the GDP, and the energy used by households for their residential and personal transportation needs.
For a country like Canada in which up to one-third of total energy use is in the second category – the household consumption of fuel and electricity – an increase in per capita GDP will by itself contribute to a decrease in the overall energy intensity of GDP. In Canada, as in other rich, industrialized countries, energy for residential and personal vehicle use is highly saturated and tends to grow primarily with population rather than GDP. Therefore, increases in GDP per capital will have the effect of reducing the contribution of personal energy use to the total E/GDP, all else being equal (Figure 4). Between 1995 and 2010, this “per capita GDP” impact contributed 23.5% or 0.62 MJ/$ of the overall decline in E/GDP.
The energy intensity of most business sectors have been improving. A further 22% or 0.58 MJ/$ of the improvement in Canada’s overall energy intensity resulted from changes – almost all reductions – in the individual energy intensities (E/value added) of the six aggregate sectors of the business economy (Figure 4).
For the six business economy sectors, energy consumption grew slower than value added for all but one sector – the oil and gas industry (Figure 6). Although this industry makes up a relatively modest share of Canada’s GDP (barely 10% for the entire energy sector, including electricity generation and transmission, oil and gas production, refineries, pipelines, and gasoline stations), its energy intensity rose dramatically during the 1995-2010 period as production shifted from conventional oil to energy-intensive SAGD (steam assisted gravity drainage) extraction of bitumen from oil sands.

Figure 6. Disaggregation of sectoral energy intensity contributions in the business (red bars) and household (blue bars) sectors to the total change in energy intensity of the Canadian economy, 1995–2010.
Offsetting the impact of this trend in the oil and gas sector were the effects of declines in the energy intensities of the other aggregate sectors of the business economy, particularly the service sector (Figure 6). The service sector comprises over two-thirds of Canada’s GDP, so even a relatively modest improvement in its energy requirements per dollar of value added translates to a significant impact on the overall energy intensity of the Canadian economy. There were additional intensity declines in power production, general manufacturing and primary processing industries, and a relatively small decline in freight transportation.
Still, the net contribution of intensity declines in the business economy to the overall decline and improvement in E/GDP in Canada – at 22% – was less than half the contribution – at 48% – from the impact of inter-sectoral structural change in the economy.
The net changes in the energy intensity of the household economy have been small. The net impact on Canada’s overall E/GDP of changes in per capita energy use in the household sector was smaller still, at 6.3% or 0.17 MJ/$ – less than one-third of the net impact of intensity changes in the business economy sectors. Most of this decline in the household sector was associated with an improvement in the energy intensity of residences as opposed to personal transportation. Indeed, a small increase in the per capita energy use of personal transportation partly offset the larger negative impact from a decline in per capita energy use for residences.
Implications of these findings
To our knowledge, our report is the first study of its kind to deconstruct an observed trend in the total Energy/GDP ratio of an economy, including separate and additive decompositions of the energy intensity of a GDP-producing business sector and the residential and personal transportation energy of the household sector. Our results show that in Canada between 1995 and 2010, 71% of the decline in the total E/GDP ratio was attributed to structural factors, while the remaining 29% was assigned to a net improvement in the sector-specific energy intensities of the business economy and the per capital energy intensity in the household economy.In other words, structural shifts in the composition of Canada’s economy were more important than business sector and household energy intensity changes in contributing to the total E/GDP over the 1995-2010 period. This fact has implications for both the methodology of energy planning and analysis and for the practical identification of strategies for improving the energy productivity of the economy –strategies that extend far beyond the dynamics of fuel and electricity commodity markets. Perhaps most importantly, our study begins to quantify the extent to which the level and the pattern of fuel and electricity demand in the society is derived from the decisions and behaviours in the larger economy that give rise to the demand for energy services, decisions and behaviours that are not themselves much influenced by fuel and electricity commodity markets and their associated policies.
Even in Canada, with its relatively large oil and gas production and export industry, the energy sector makes up barely 10% of GDP. The energy commodity sector is being disrupted not only by new ways of producing and utilizing fuels and electricity, but by profound changes in the larger economy (e.g. digital economy, Y-generation driving personal transport preferences, etc.) that are resulting in lower demands for the energy services that drive fuel and electricity markets.
Historically, over the 1995-2010 period, the destruction of fuel and electricity demand relative to GDP was at least as likely to be the result of demographic, economic and technological trends well outside the energy commodity business and policy arenas as it was to be the result of overt attempts to improve the efficiency of fuel and electricity utilization (for example, with vehicle fuel-efficiency standards and phasing out coal-fired power). Governments and businesses ignore these seismic forces at their peril; policy and business strategies need to be informed by the possible impacts on fuel and electricity demands in a range of plausible scenarios of how the future demand for energy services may develop.
The imperative to reduce greenhouse gas emissions adds another urgent dimension to the need to understand how human wants and needs might be provided with lower levels of energy service demand than have prevailed historically. The goal established by the Paris Agreement in December 2015, to limit global warming to well below 2 degrees C, will not be accomplished with efficiency and renewable energy alone; it will require bending the emissions baseline itself. In Canada and globally, that curve has been bending in the direction of higher energy commodity productivity to the extent it has emerged as the single, largest factor in moderating GHG emissions growth. Given the necessity to continue reducing E/GDP to achieve objectives for GHG emission reductions, it is important to identify where policy interventions could accelerate trends that decrease total E/GDP and where they could moderate or retard changes that increase total E/GDP.
This in turn requires expanding the scope of what we understand to constitute “the energy systems” to include the chains of causes and effects that give rise to fuel and electricity demand. In a future blog in this series, we will delve further into the changes that occurred in the energy intensities of each of the sectors we defined for our research. We’ll show that the themes of structural shifts in the economy versus efficiency improvements identified at the macro level in this paper are equally important in understanding the intra-sectoral dynamics of fuel and electricity demand.
Footnotes
1 From National Inventory Report 1990-2014 Greenhouse Gas Sources and Sinks in Canada. April 2016, Environment Canada. https://www.ec.gc.ca/ges-ghg/default.asp?lang=En&n=662F9C56-1
Cartoon reproduced with permission from CartoonBank.com.