Posted on Wed, 07/03/2019 - 06:32
By Adekunbi (Kunbi) Adetona, MSc, PAg, PhD Student

Human activities have had a major impact on the flows of carbon (C) into and out of the atmosphere, leading to concerns about greenhouse gas (GHG) emissions and climate change. Most of the attention has been focused on combustion of fossil fuels, which releases carbon dioxide (CO2) into the atmosphere. However, the flows of C through the agri-food system have largely been ignored.
This is because agricultural systems first pull C out of the atmosphere when the crops grow, and then return the same C to the atmosphere when the agri-food products are consumed or the biomass decays. In essence, the nation’s C accountants consider agricultural C flows as ‘a wash’ and focus primarily on the sector’s contribution to emissions through the production of potent GHGs, like methane and nitrous oxide (see Box 1).
Box 1: Agricultural GHG Emissions
Canada’s agricultural sector produces about 60 megatonnes (Mt) of carbon dioxide equivalent (CO2e), or about 8% of all GHG emissions in the country. These are associated with:
- Nitrous oxide (N2O) emissions from excess nitrogen in agricultural soils;
- Methane (CH4) and N2O emissions from animal production (e.g. cow burps and manure management); and
- CO2 emissions from the use of lime and urea fertilizer on agricultural soils.
GHG accountants1 also document the annual C stock changes in agricultural soils (est. at -9.6 Mt CO2e in 2017). The negative number indicates that soil C stocks are increasing. Note that the total annual flows of C are not quantified.
For my PhD research, I want to understand more about this missing and mysterious agri-food C, so I set about to quantify the C flows through Canada’s agri-food system that begin with crop production in agriculture and ends with the production of food, biofuels and other products. My hope is to explore new opportunities that can reduce the environmental footprint of the agri-food sector.
For comparison, I also quantified the C flows through the energy system that starts with the recovery of crude oil in Canada and ends with the production of refined petroleum products (RPPs).
After crunching hundreds of thousands of numbers (yes, I counted them too), and struggling to decipher and communicate their meaning, my paper has just been published in Anthropocene, a scientific journal named after the current geological age when human activity has been the dominant influence on climate and the environment (Figure 1).
What did I learn? I thought you would never ask!
Figure 1. Follow this link to access our paper. Its open access, so free to download.
Agri-food C flows are BIG, really BIG
Over our study period (2010-13), Canada’s agricultural crops pulled 141 Mt of elemental C2, or 517 Mt CO2, out of the atmosphere each year and used it to build plant biomass. That is a lot of C, equivalent to about 71% of Canada’s total reported GHG emissions for 2013 (729 Mt CO2e/yr)3.
It is also almost the same amount of C (144 Mt C/yr) in all of the crude oil that Canada extracted from the Earth over the same study period. When you consider that Canada produces more than twice the amount of crude oil than it consumes in a year (Canada exports a lot of oil), we can calculate that each year Canadian agriculture pulls about twice the amount of C out of the atmosphere that is put into the atmosphere from the combustion of all RPPs within Canada.
For conversion efficiency, the agri-food sector could take some lessons from the oil sector
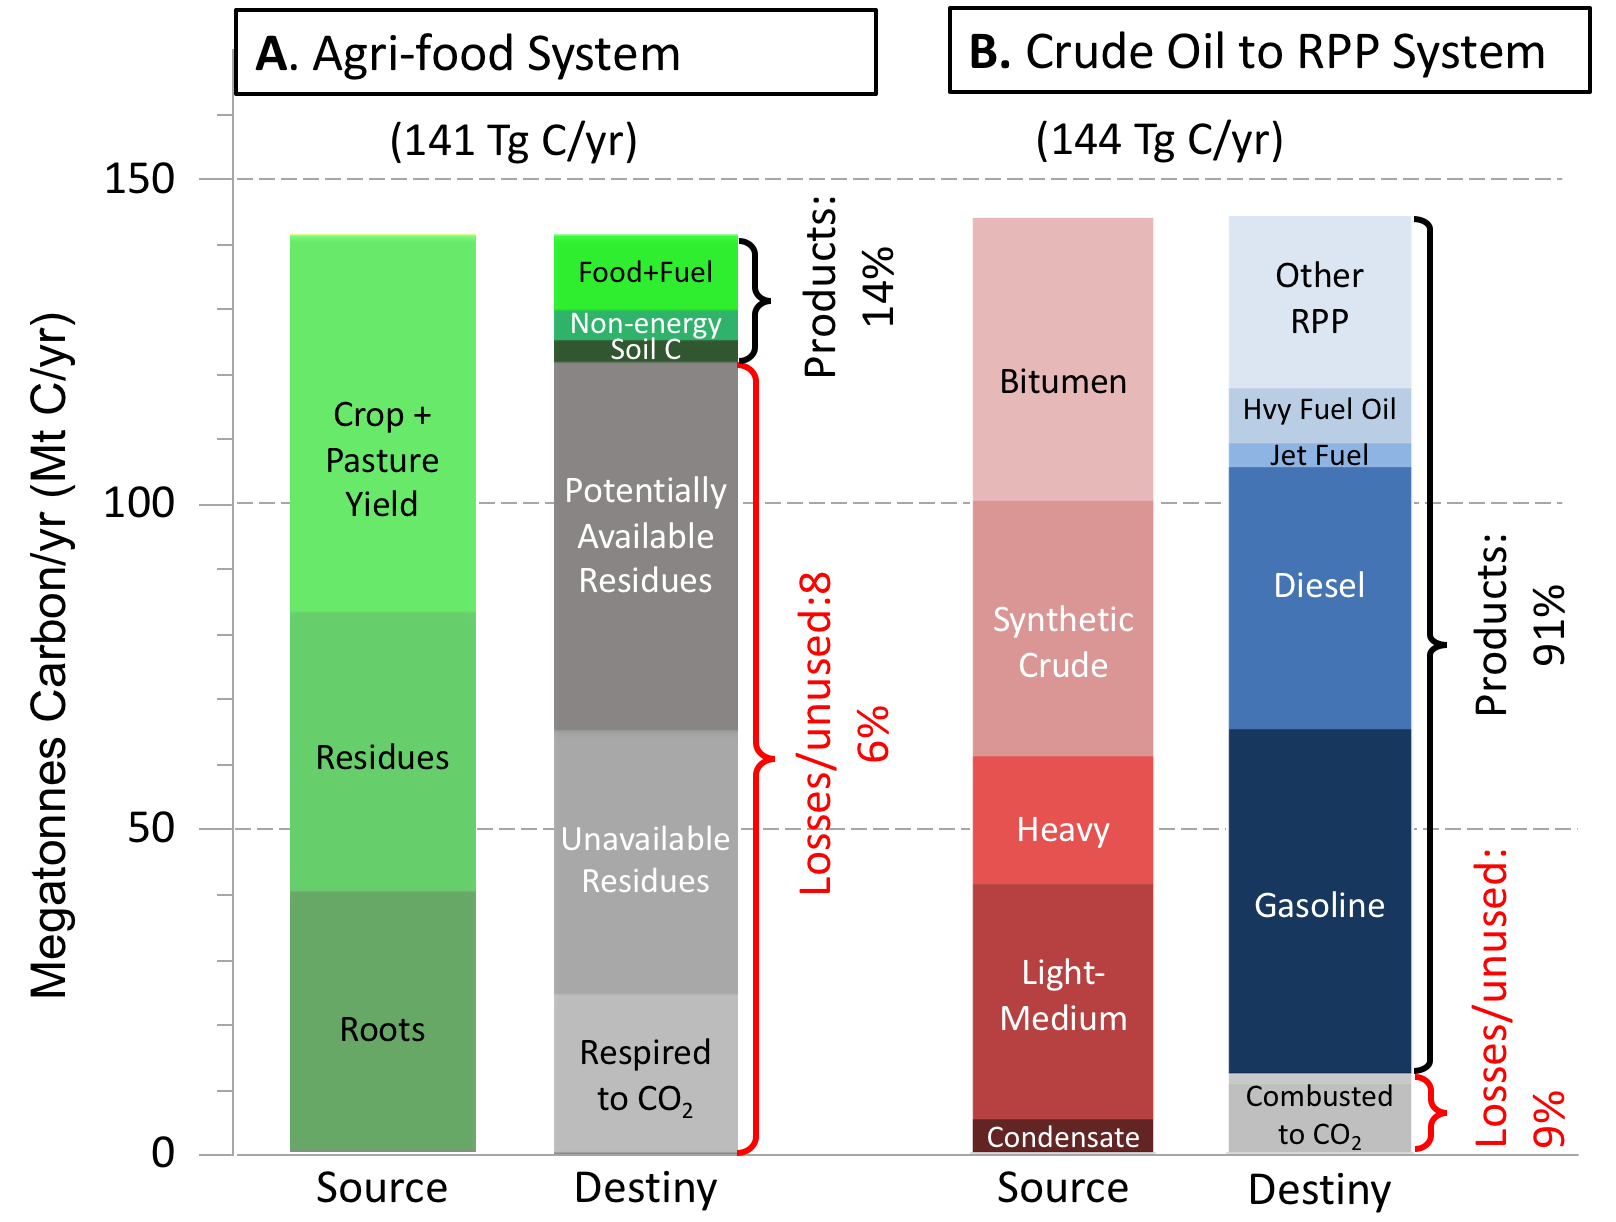
Figure 2. A comparison of carbon (C) source destiny in the agri-food (A) and the crude oil to refined petroleum product (RPP) (B) systems in Canada for the 2010-2013 study period.
In the agri-food sector, only about 14% of the C removed from the atmosphere in a given year ends up in the value-added end products, including food, biofuels, industrial products and carbon stored in the soils (Figure 2A). In comparison, RPPs account for 91% of the crude oil recovered in Canada. Only 9% is lost in the conversion process (Figure 2B). Details on the low conversion efficiency in the agri-food sector can be seen in Figure 3, and attributed to a number of factors:
- The C stored in plant roots plus a portion of the above-ground biomass is needed to maintain healthy soils, so is not available for conversion into products;
- Animal production (especially ruminant animals like cattle and sheep) have low conversion efficiencies (i.e. input feed to value-added products) of 2% to 20%. The remainder is respired, deposited as feces or urine, or released to the atmosphere as methane;
- Unused crop residues (plus manure, etc.) that are either burned or left to decompose. We estimate about 55 Mt C/yr could be used as a source of energy, or as a way of keeping the C from returning to the atmosphere. In GHG terms we are looking at a potential of 200 Mt CO2/yr or 27% of Canada’s GHG emissions over the study period.
Certainly, the production of RPPs is different than the production of food products, but the incredibly low conversion efficiencies in the agri-food sector suggest that lessons could be learned from the oil to RPP sector.
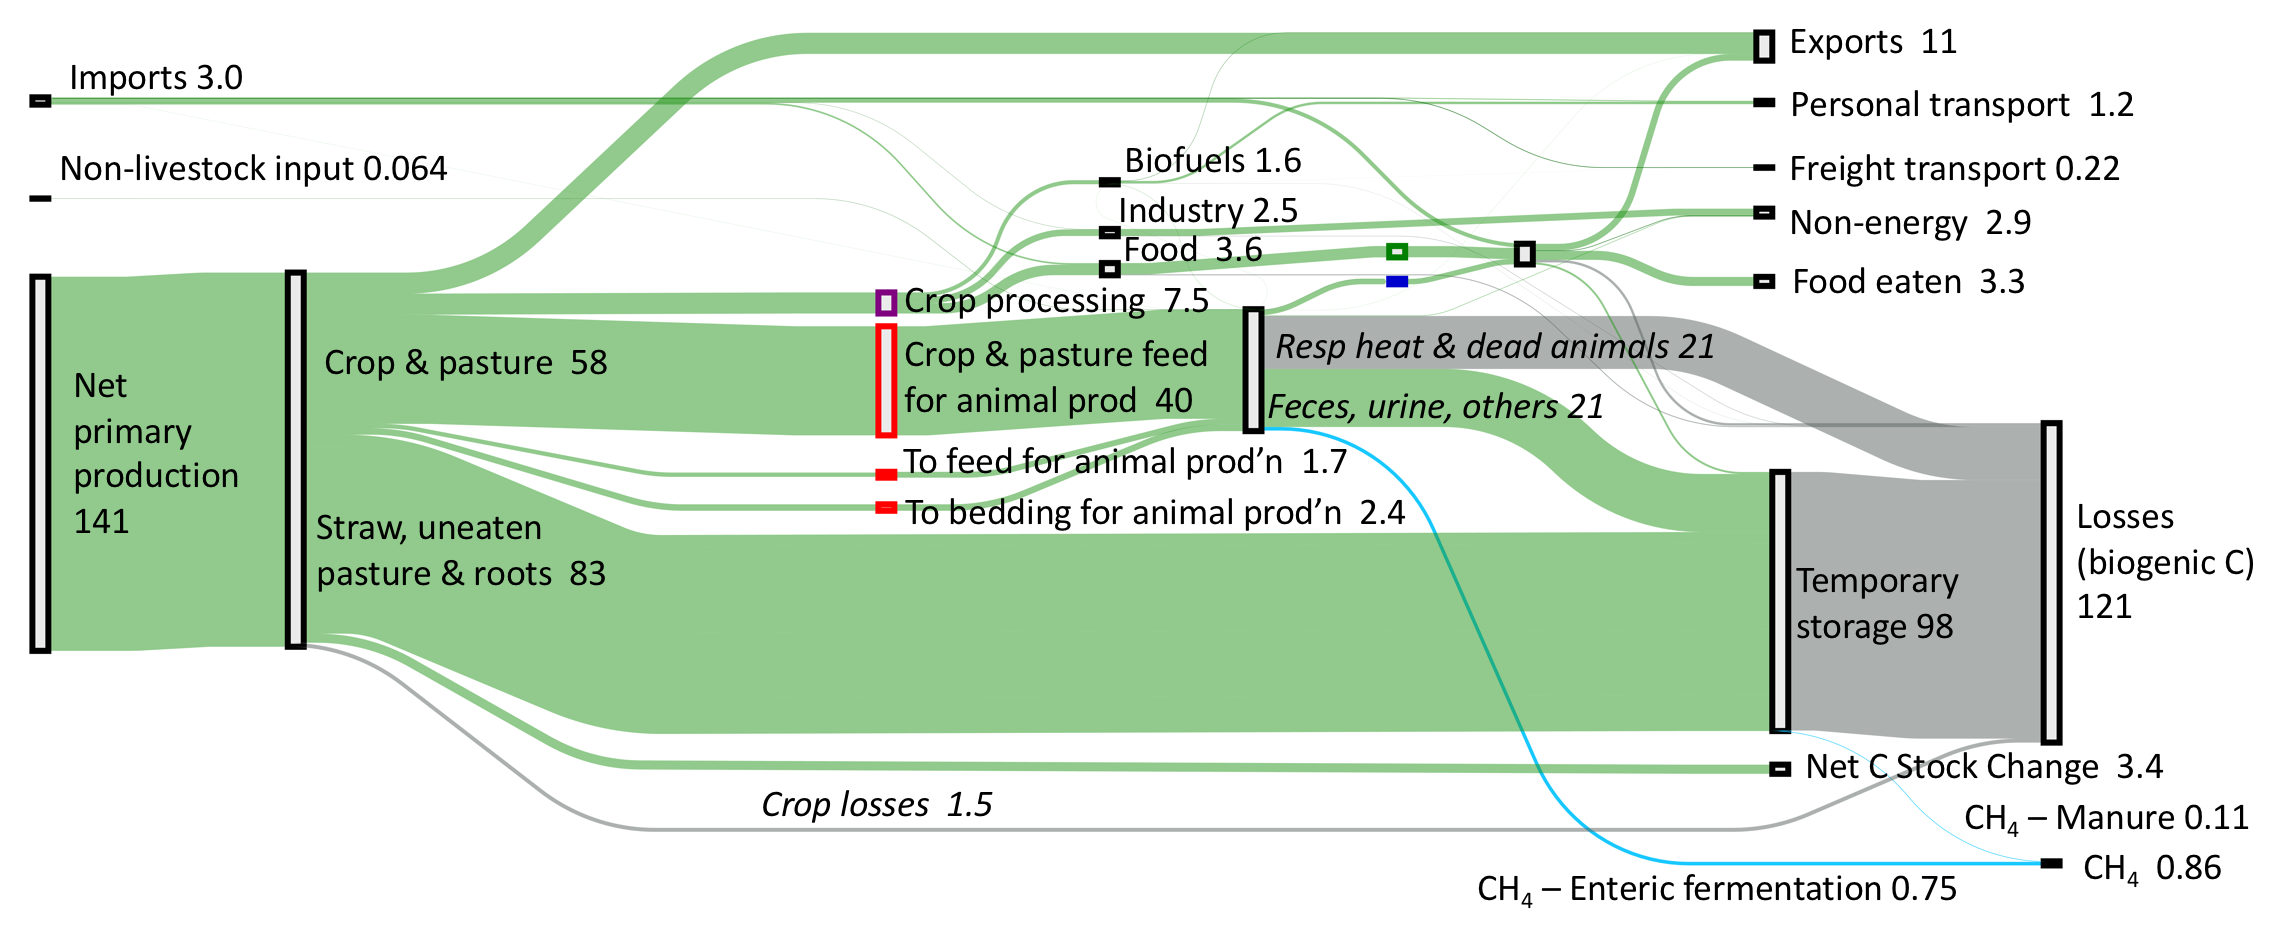
Figure 3. Carbon (Mt C/yr) flows (average 2010–2013) through the Canadian agri-food system to meet export and domestic demands for food, fuel, and non-energy uses. Note that only 2.3% (3.3 Mt C/yr) of Canada’s net primary crop production (141 Mt C/yr) ends up as food eaten, and some of that comes from imported food.
For Energy Return on Investment (EROI), the agri-food sector could take some lessons from the oil sector
To this point, I have focused on the C flows through the agri-food and crude oil systems, but our study also looked at energy flows. In particular, we were interested in the exogenous energy (electricity, diesel and natural gas) inputs needed to create and deliver the end products for the agri-food (food, biofuels, etc.) and crude oil-RPP (diesel, gasoline etc.) systems.
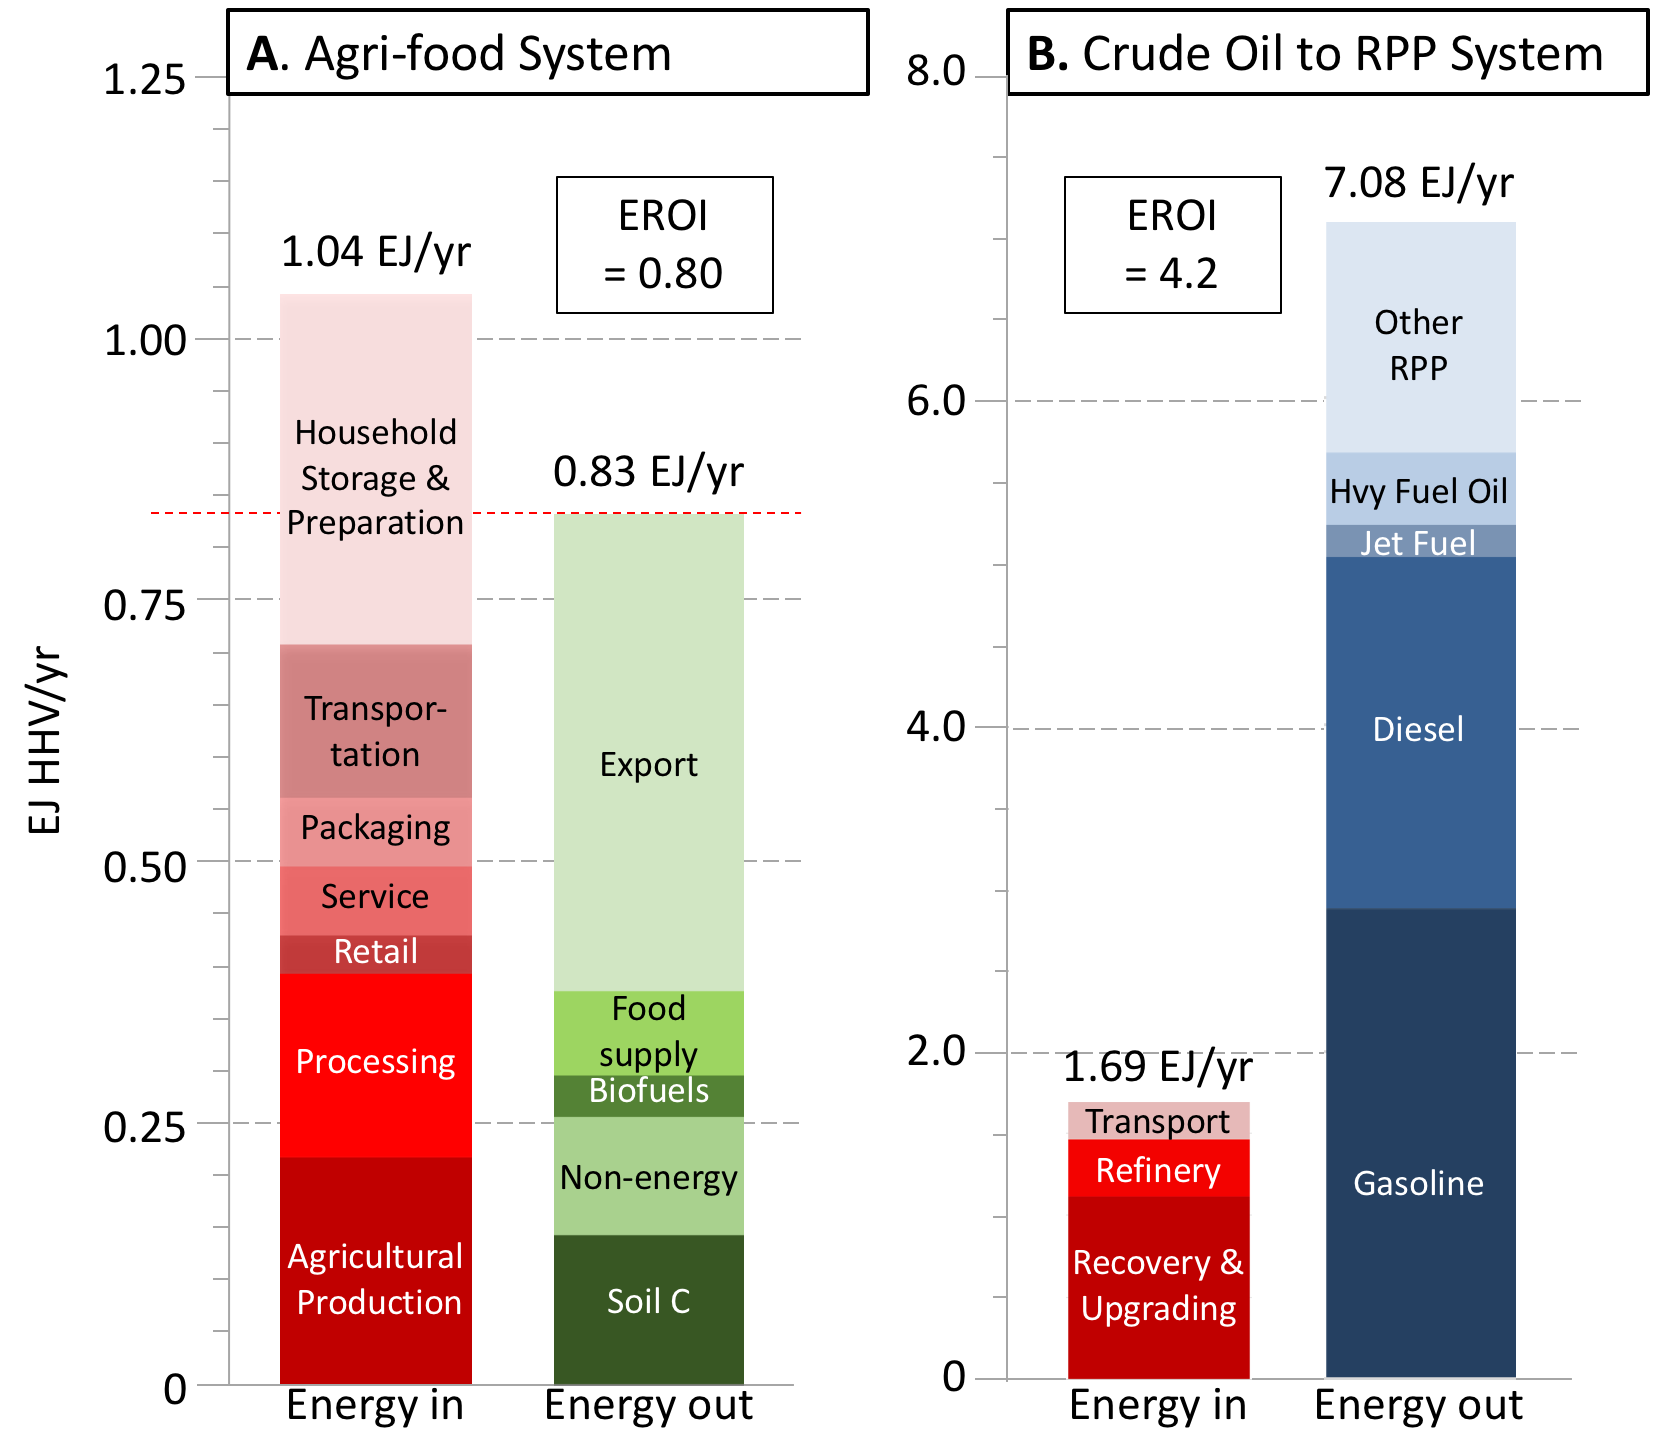
Figure 4. Fuel and electricity used in the agri-food (A) and crude oil-RPP (B) energy systems in Canada. The Energy Return on Investment (EROI) is calculated as the ratio of energy out : energy in.
Drawing on the work of Heller and Keoleian,4 we calculated that the EROI for the agri-food sector was less than 1.0 (Figure 4A). Therefore, for every unit of exogenous energy put into the system, only about 0.8 units of energy ends up in the products. The input energy includes that needed to make the fertilizer, herbicides, pesticides and drugs for growing the crops and animals, that required to plow/harvest the fields and transport the crops, and that needed to process, package, move, sell and store the food products, etc., before consumption.
In comparison, Canada’s crude oil-RPP system was calculated to have an EROI of 4.2. In other words, for every unit of energy put in to recover, refine, store and transport crude oil, 4.2 units of RPPs were produced (Figure 4B). That represents a 5.3-fold higher EROI for the crude oil-RPP system than for the agri-food system. Again, maybe the agri-food system has lessons to learn from the crude oil-RPP system.
Why? While similar in scale, the Canadian agri-food and crude oil–RPP systems are dramatically different in conversion efficiency and EROI. Reasons include:
- The nature of the feedstocks (fossil fuels are more energy dense than biomass);
- Agri-food products, must typically meet requirements other than energy content, including taste, texture, esthetics and nutritional value and that adds to the energy cost and residue production;
- Susceptibility of biomass or agri-food products to decompose more quickly than fossil fuels or RPPs; There are many more companies involved in the agrifood system than in the oil-RPP system, creating barriers to efficiency improvements.
What can be done?
In a world with a rapidly growing population that is increasingly concerned about climate change and sustainability, these findings highlight the need to take a close and critical look at the agri-food sector to significantly improve both conversion efficiency and EROI. We propose the following:
- Reduce the production and consumption of food products characterized by low conversion efficiencies or EROI, such as ruminant production of meat and milk products. It is worth noting that the production of these same products is often associated with large system-level emissions of CH4 or N2O, both potent GHGs;
- Increase the production and consumption of food products that require low fuel and electricity inputs for their growth, harvesting, transport, processing and preservation. For example, peas, lentils and bean produced with biological nitrogen fixation, thereby not requiring fertilizer nitrogen inputs.
- Divert residual carbon (e.g. crop residues) to the production of energy that would reduce demand for fossil fuels, or to the generation of carbon-based products that are either resistant to microbial degradation (e.g. biochar) or protected from degradation (e.g. building products); and
- Rethink the optimal use of agricultural land, balancing the need to feed the world’s growing population, contribute to the local economy and minimize adverse climate and biodiversity impacts.
Footnotes
1 I focused on the average annual flows for the 2010 to 2013 period because the data were available for this period. These dates should also tell you that I have been working on this for a few years.
2 A megatonne (Mt) is a million metric tonnes and that is the same as a terragram (Tg), the units we use in the paper. One tonne of elemental C when in the form of CO2 would be 3.67 tonnes CO2, given the weight of the oxygen in CO2.
3 Environment and Climate Change Canada 2017, "National Inventory Report 1990-2015: Greenhouse Gas Sources and Sinks in Canada," Canada’s Submission to the United Nations Framework Convention on Climate Change. Part 1.
4 Heller, M.C., Keoleian, G.A., 2003. Assessing the sustainability of the US food system: A life cycle perspective. Agric. Syst. 76, 1007–1041
Photo by James Hammond on Unsplash