Posted on Tue, 02/24/2015 - 08:12
Appendix of the blog post A ‘business-as-usual’ perspective on Canada’s energy future to 2060, by Bastiaan Straatman and David B. Layzell
The following paragraphs summarize key historical data and the basis for future projections of data that ultimately define the nature and environmental impact of Canada’s energy systems.
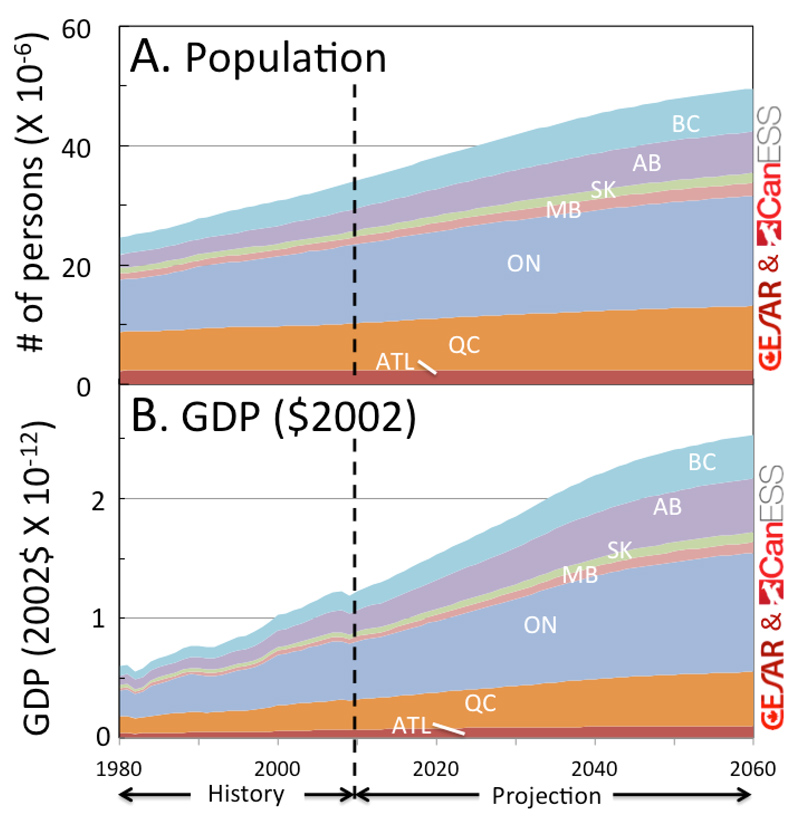
Figure 2. Historical data and a CanESS reference projection to 2060 for the Canadian population (A) and gross domestic product (GDP)(B).
1. Population and GDP Growth are perhaps the most important drivers affecting Canada’s energy demand and GHG emissions. Building on historical government data1 for GDP and births/deaths, emmigration, immigration and migration by province to 2010, the CanESS model adjusts these to map onto government GDP and population projections to 20352 and then slowly dampens growth estimates out to 2060 (Fig. 2A&B). Note that by 2060, we project a Canada’s population of almost 50M and a GDP/capita that is 35% higher than in 2010 (data not shown).
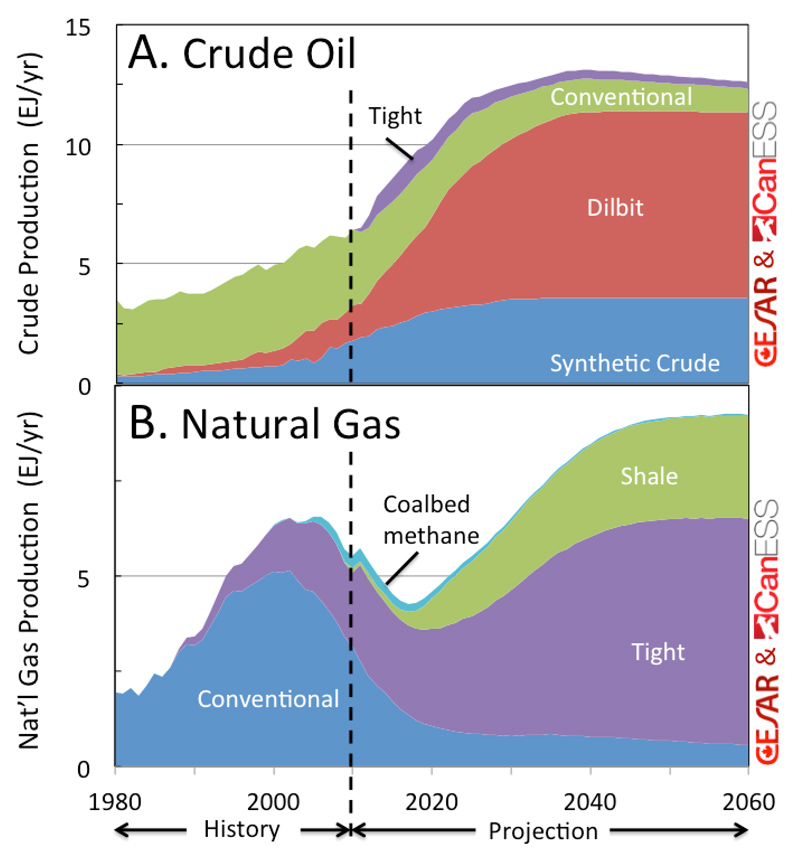
Figure 3. Historical data and a CanESS reference projection to 2060 for Canadian the crude oil (A) and natural gas (B) production.
2. Oil and Gas Production not only produces energy rich fuels and chemicals, but uses energy in its recovery and processing. To project future rates of production (Fig 3.) we used government projections3 to 2035 and then gradually stabilized production as suggested by others4. Existing recovery and upgrading technologies were used to calculate the resulting energy demand and greenhouse gas (GHG) emissions. By 2060 unconventional oil (primarily dilbit) and natural gas (tight / shale gas) was projected to account for most of Canada’s production.
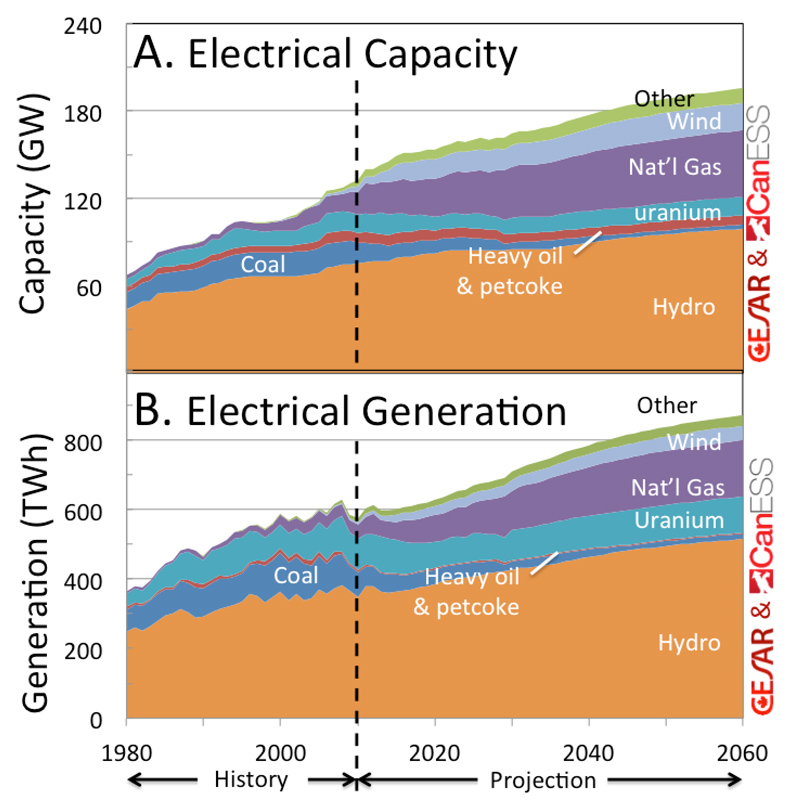
Figure 4. Historical data and a CanESS reference projection to 2060 for Canadian electricity capacity (A) and generation (B).
3. Electricity capacity and generation projections were based on historical data5 and government projections6 to 2035 by decommissioning existing conversion infrastructure and introducing new facilities in the model. Post 2035, we projected marginal technology share changes to meet calculated new demand, power plant end-of-life and existing federal government policies restricting the carbon intensity of new coal plants. This resulted in a significant projected rise in natural gas derived power over the net 45 years (Fig 4).
![]()
Figure 5. Historical data and a CanESS reference projection to 2060 for person-km travelled per year (A) and the stock of personal vehicles (B) in Canada.
4. Personal transportation in the model includes variables for number of families, trips number and distance per family, persons per vehicle and the stock of various vehicle types (including fuel source and vehicle efficiency) by province and year. Using historical government data7,8 on these and many other factors, the CanESS modellers built a fully integrated, historically consistent, bottom-up model describing historical energy demand and GHG emissions for personal transportation. For future projections, trends in the underlying variables were analyzed and projected into the future and then used with the model. The resulting per capita travel by mode share (Fig. 5A) and the number of vehicles by vehicle type. (Fig 5B) are a reflection of a future world where personal vehicles are still primarily gasoline driven and the trend toward light trucks (vs cars) is maintained.
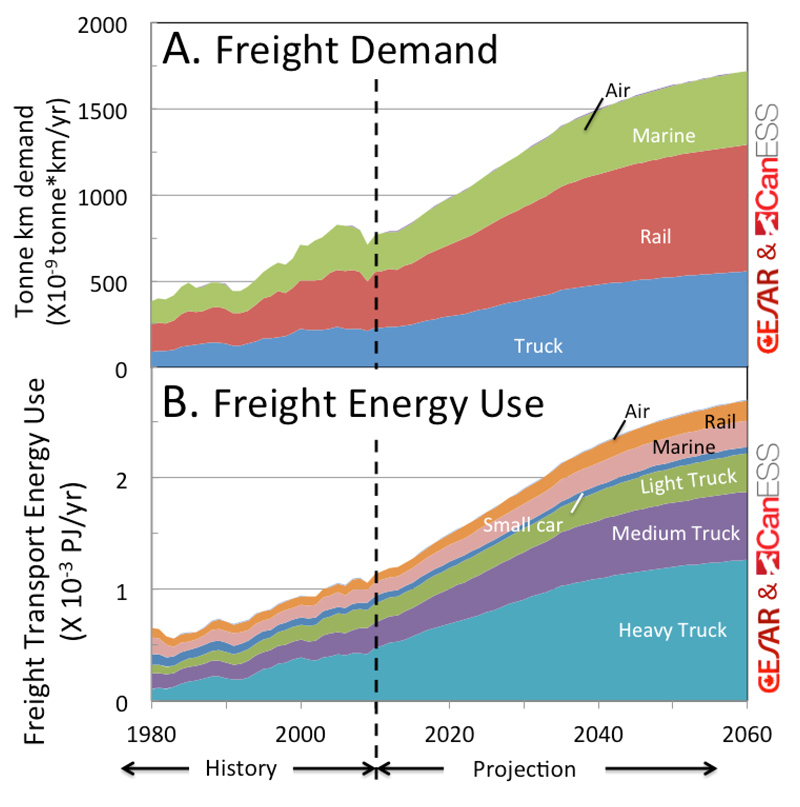
Figure 6. Historical data and a CanESS reference projection to 2060 for freight demand (A) and freight energy use (B) in Canada.
5. Freight transport demand in the model is driven primarily by Gross Output, which is a more accurate descriptor of economic activity than Gross Domestic Product (GDP). Historical values for Gross Output9 were combined with government data on tonnes-km for up to 42 different commodity types using either marine or rail transport10, trucking (via various truck / fuel types)11 or air freight12. The model was calibrated using 30+ years of historical data and then applied to future projections in which past trends of key variables were extrapolated, with dampening, into the future. Fig 6 provides a window on the resulting future projections, showing a significant rise in freight demand (A) and energy use (B).
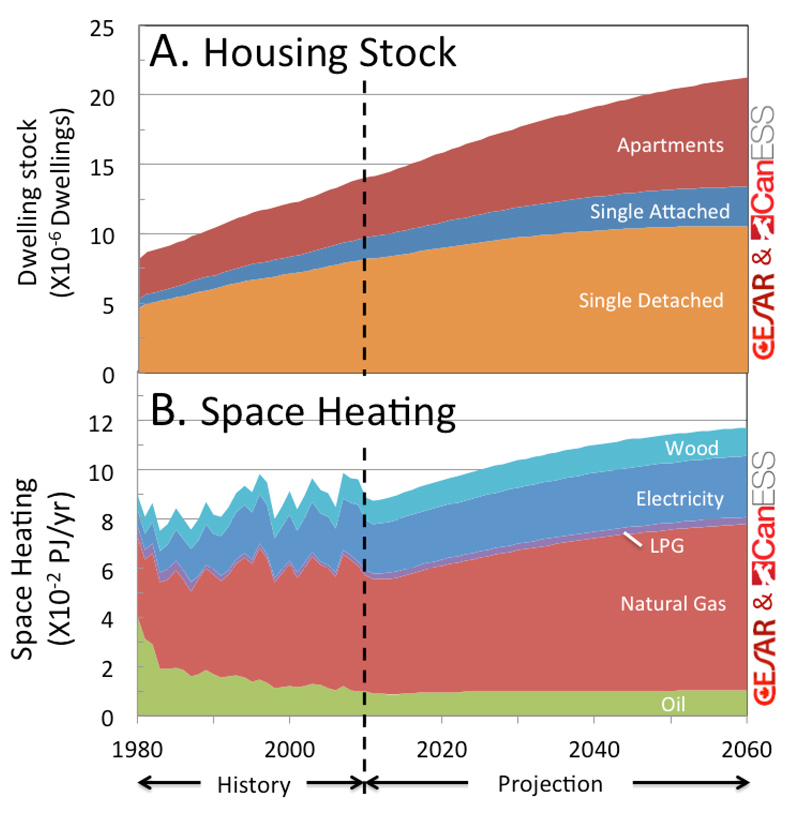
Figure 7. Historical data and a CanESS reference projection to 2060 for the housing stock (A) and energy use for space heating (B) in Canada.
6. Residential energy consumption in the CanESS model is driven primarily by the dwelling stock, a function of population and occupancy level. Historic government data on housing stocks13 was used to create a stock rollover model of dwellings by type (single detached, single attached, apartment) that also links to information on the thermal envelope, floor area, vacancy fraction and the occurrence of renovation (esp. of the thermal envelope and furnaces) or demolition. By also integrating historical data on weather conditions14 for each province, thermostat settings, the fuel and efficiency21 of space and water heating technologies, and the lighting technologies being deployed, CanESS provides a comprehensive, integrated, bottom-up model of residential energy use across Canada. When trends for the key variables are projected into the future and the model is applied to these data, projections such as those presented in Fig. 7 can be made. Note the projected shift to relatively more apartments in the dwelling stock (an extension of recent trends), and the increased role for natural gas (Fig 7B), a reflection of more projected population growth in provinces with natural gas furnaces.
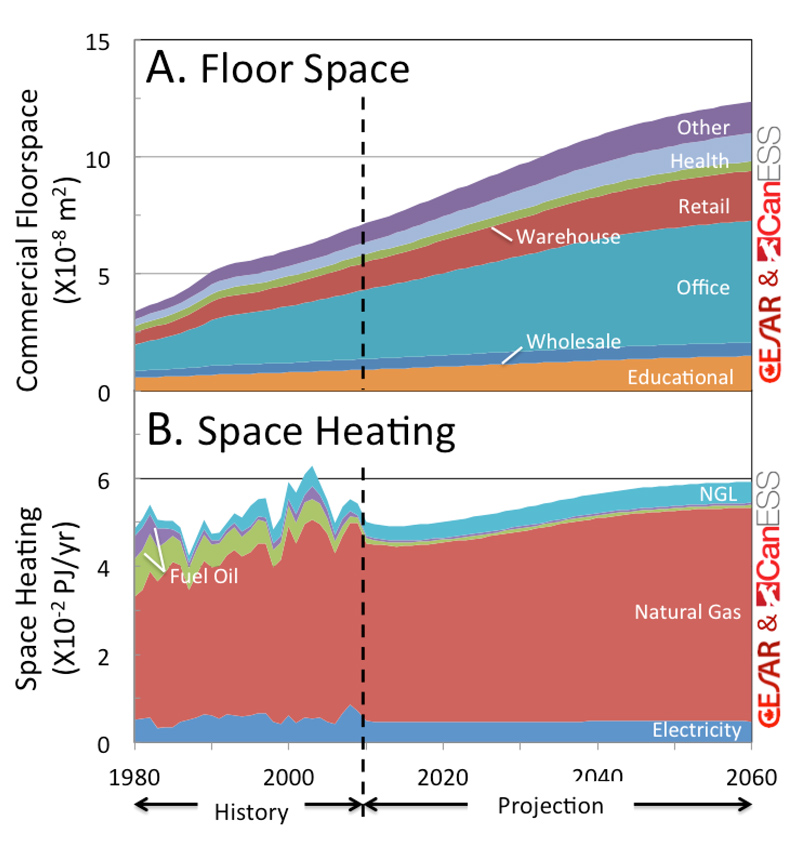
Figure 8. Historical data and a CanESS reference projection to 2060 for the commercial floor space (A) and energy use for space heating (B) in Canada.
7. Commercial energy consumption in the model uses population, demographic and GDP data to account for government data on commercial floor space16 for 10 commercial sectors (retail, office, educational, health, recreational, … etc). The algorithms developed are then used to project floor areas for each sector and province into the future (Fig. 8A). This information is combined with historical data on energy efficiency17 in the commercial sector to calculate demand for energy commodities for each sector/province for space heating18 (Fig 8B), space cooling, water heating, lighting, auxiliary equipment, and auxiliary motors. The model is calibrated to fit with government data resources19 that record observed commercial energy use.
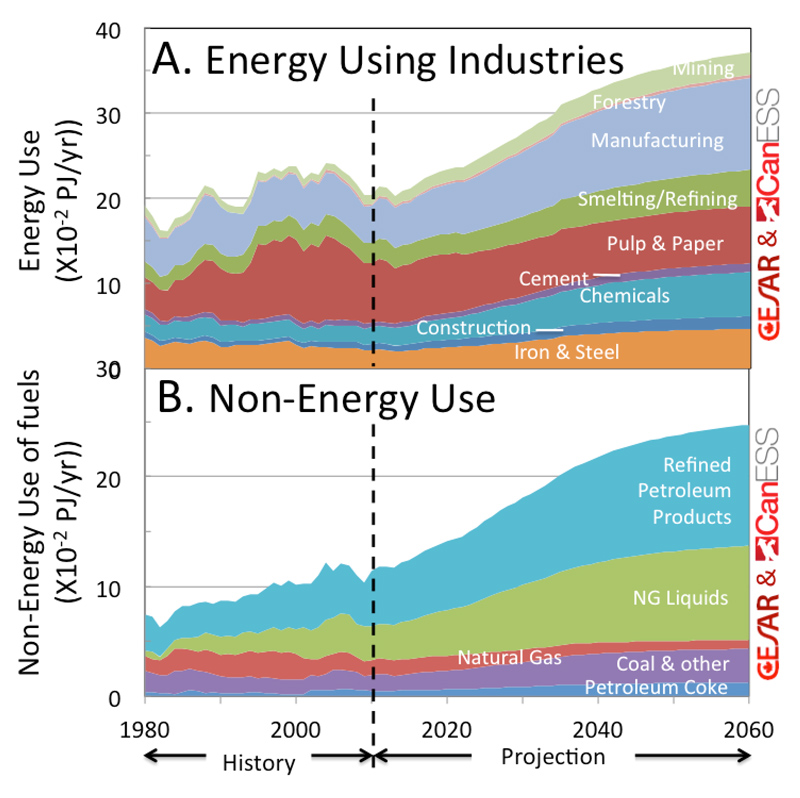
Figure 9. Historical data and a CanESS reference projection to 2060 for the industrial energy use (A) and non-energy use of fuels (B) in Canada.
8. Industrial energy consumption in the CanESS model is calculated from values for Gross Output for a number of industry sectors and calibrated to fit with government data20 on energy use by sector. The resulting sector energy intensities (energy use/$) permit projection of future energy use by sector (Fig. 9A) from projections of Gross Output. For non-energy use of fuels (e.g. plastics, petrochemicals, etc) the model draws on government data21 that the model links to Gross Output for those sectors to determine non-energy use intensity that can be used to calculate future projections (Fig. 9B).
Footnotes
2 National Energy Board’s Canada’s Energy Future 2013
3 National Energy Board’s Canada’s Energy Future 2013 oil, and natural gas projections
5 Statistics Canada CANSIM tables 127-0001, 127-0006, 127-0007, 127-0008, as well as Environment Canada data, NEB data, and CANWEA data
6 National Energy Board’s Canada’s Energy Future 2013 electricity projections
10 TKM data obtained from Transport Canada by sctg2d (42 commodity classes),
11 TKM data from Statistics Canada for these commodities classes; The historic fuel consumption efficiency is not readily available in Canada and is derived from US EPA data
13 NRCan’s Residential Simulator which processes Eco Energy Retrofit record data
14Environment Canada hourly temperature for 24 weather stations across Canada
15 OEE NRCan trends database used to initially populate model variables. The intensity settings in CanESS are then calibrated to reproduce observed commercial energy use from Statistics Canada CANSIM table 128-0016
17 Including OEE NRCan trends database models.
18 For space heating, heating demand is calculated based on the commercial floor space, and then adjusted for wild heat from equipment and lighting and solar gain.
19 The intensity settings in CanESS are calibrated to reproduce observed commercial energy use from CANSIM 128-0016.